
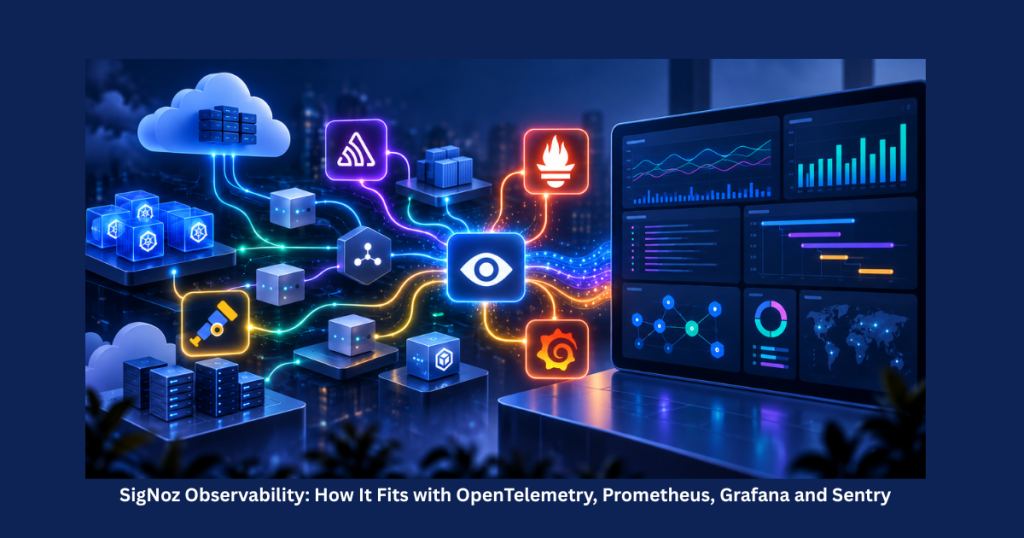
Modern applications are becoming increasingly distributed. A single user request may pass through an API gateway, Kubernetes cluster, database, microservice, cache, message queue, and third-party service before a response reaches the user.
When something goes wrong, traditional monitoring may tell you that latency is high, CPU usage has increased, or an API is returning errors.
But it may not immediately explain why.
This is where SigNoz observability becomes useful.
SigNoz brings metrics, logs, traces, exceptions, dashboards, and alerts into a unified observability environment. When combined with OpenTelemetry, it helps DevOps and SRE teams understand application behavior across distributed environments.
What Is SigNoz Observability?
SigNoz is an open-source observability platform designed to help engineering teams monitor and troubleshoot applications and infrastructure.
Instead of looking at metrics, logs, and traces separately, SigNoz allows teams to investigate these signals together.
A typical architecture looks like this:
Application
|
OpenTelemetry
|
+———+———+
| | |
Metrics Logs Traces
| | |
+———+———+
|
SigNoz
The main benefit is correlation.
For example, a monitoring dashboard may show that API latency increased from 300 milliseconds to four seconds.
A distributed trace may then reveal that a database query took 3.5 seconds.
Application logs can provide additional details about the slow query, timeout, or service error.
This turns separate monitoring signals into a connected troubleshooting workflow.
What Is OpenTelemetry?
OpenTelemetry, often called OTel, is an open-source framework for generating, collecting, processing, and exporting telemetry data.
It supports important observability signals such as:
- Metrics
- Logs
- Distributed traces
OpenTelemetry is not a monitoring dashboard or observability backend.
Instead, it acts as the instrumentation and telemetry layer between applications and monitoring platforms.
A simple OpenTelemetry with SigNoz architecture may look like:
Application
|
OTel SDK
|
OpenTelemetry Collector
|
SigNoz
This approach is useful because applications are not tied to a single monitoring vendor.
Teams can standardize telemetry collection with OpenTelemetry and decide where that telemetry should be stored, analyzed, and visualized.
Monitoring vs Observability
Monitoring and observability are related, but they answer different questions.
Monitoring usually asks:
“Is something wrong?”
Observability asks:
“Why is the system behaving this way?”
For example, monitoring may report:
API latency: High
HTTP 500 errors: Increasing
CPU usage: Normal
Memory usage: Normal
Observability can provide deeper context:
API Request
|
Authentication: 40 ms
|
Application Logic: 90 ms
|
Database Query: 3.8 sec
Instead of investigating every application component separately, engineers immediately know where to focus.
That is the real advantage of observability.
SigNoz vs Prometheus and Grafana
A common question is whether SigNoz replaces Prometheus and Grafana.
In many environments, it does not need to.
Prometheus is widely used for metrics collection, storage, querying, and alerting.
Grafana is commonly used to create dashboards and visualize data from Prometheus and other data sources.
SigNoz covers a broader observability workflow by bringing metrics, logs, and traces together.
This means the comparison of SigNoz vs Prometheus and Grafana is not always one-to-one.
An existing monitoring environment might look like:
Application
|
+– Prometheus –> Grafana
|
+– Loki ——-> Grafana
|
+– Sentry
|
+– OpenTelemetry –> SigNoz
This allows teams to adopt SigNoz gradually instead of replacing their entire monitoring stack.
Where Sentry Fits
Sentry primarily focuses on application errors, exceptions, stack traces, releases, and developer-focused troubleshooting.
SigNoz has some overlap, but its scope is broader.
For example, Sentry may help identify which line of application code triggered an exception.
SigNoz may help show the full request path, service latency, related logs, traces, metrics, and infrastructure behavior.
Some teams may therefore continue using both.
Why SigNoz for Kubernetes Monitoring Is Useful
Kubernetes makes troubleshooting more complicated because applications are spread across pods, services, ingress controllers, databases, queues, and external services.
Infrastructure metrics may show that all Kubernetes nodes and pods are healthy while users are still experiencing slow application performance.
This is why SigNoz for Kubernetes monitoring can be valuable.
Distributed tracing helps engineers follow a request across multiple services.
For example:
User
|
Ingress
|
Frontend Pod
|
API Pod
|
Authentication Service
|
Database
If the database or authentication service introduces latency, the trace can help identify the affected component much faster than manually checking logs from multiple pods.
Why SigNoz GitHub Matters
Teams evaluating open-source tools often research SigNoz GitHub before deployment.
The open-source ecosystem provides visibility into the platform architecture, releases, deployment components, integrations, and development activity.
This is particularly useful for organizations considering self-hosted observability.
Self-hosting can provide more control over telemetry data, infrastructure design, data retention, and deployment architecture.
This can be important for businesses that prefer to keep application logs and tracing data within infrastructure they control.
SigNoz vs OpenObserve
OpenObserve is another open-source observability platform that teams may consider when evaluating monitoring and telemetry solutions.
Both platforms aim to provide broader observability capabilities rather than focusing exclusively on one data type.
When comparing OpenObserve with SigNoz, teams should consider factors such as:
- Telemetry volume
- Kubernetes integration
- Storage requirements
- Query performance
- OpenTelemetry support
- Dashboard requirements
- Alerting
- Infrastructure costs
- Self-hosting needs
There is no universal best platform.
The correct choice depends on the organization’s architecture and operational requirements.
Benefits of Unified Observability
The main advantage of observability is not having more dashboards.
It is reducing the time required to understand incidents.
A traditional investigation may require engineers to check Grafana, Prometheus, Loki, Sentry, Kubernetes events, application logs, and database monitoring tools separately.
A unified observability platform can reduce this manual correlation.
Some major benefits include:
- Faster root-cause analysis
- Better microservices visibility
- Correlation between metrics, logs, and traces
- Improved Kubernetes troubleshooting
- Better application performance analysis
- Reduced Mean Time to Resolution
- Standardized telemetry through OpenTelemetry
How to Start with SigNoz
Organizations do not need to migrate everything at once.
A practical approach is to start with one application or service.
Instrument it using OpenTelemetry.
Send traces to SigNoz.
Then gradually introduce metrics and logs.
Once teams understand the benefits, they can decide whether existing monitoring systems should remain or whether certain workloads should be consolidated.
Organizations that need help with OpenTelemetry deployment, Kubernetes monitoring, telemetry pipelines, or production observability can work with experienced SigNoz observability services providers to design an architecture that complements their existing monitoring stack.
Need Help Building a Modern Observability Stack?
If your team is planning to adopt SigNoz observability, OpenTelemetry, Kubernetes monitoring, or distributed tracing, our experts can help you design and implement the right observability architecture for your environment.
Explore our SigNoz observability services to build a scalable monitoring and observability strategy without disrupting your existing stack.
Final Thoughts
The move from monitoring to observability is not about replacing every existing tool.
It is about connecting information.
Prometheus can show that a metric changed.
Grafana can visualize the change.
Sentry can identify an application exception.
Logs can show application context.
Distributed traces can reveal where a request became slow.
OpenTelemetry provides the standard telemetry layer, while SigNoz observability brings those signals together into a unified investigation workflow.
For organizations running Kubernetes, APIs, microservices, and distributed applications, this can significantly improve troubleshooting and reduce the time required to identify root causes.
That is the real value of observability: not just knowing that something failed, but understanding exactly where and why it failed.
